Bias Incidents: 1990-Present
Incidents by County
Incidents by Motivation
Incidents by Target
Incidents by Type
Average Severity of Incidents
Composite Severity of Incidents
Incidents by City/Town
Incidents by City/Town (%)
Incidents per Capita
Average Severity by City
Incident Type by City
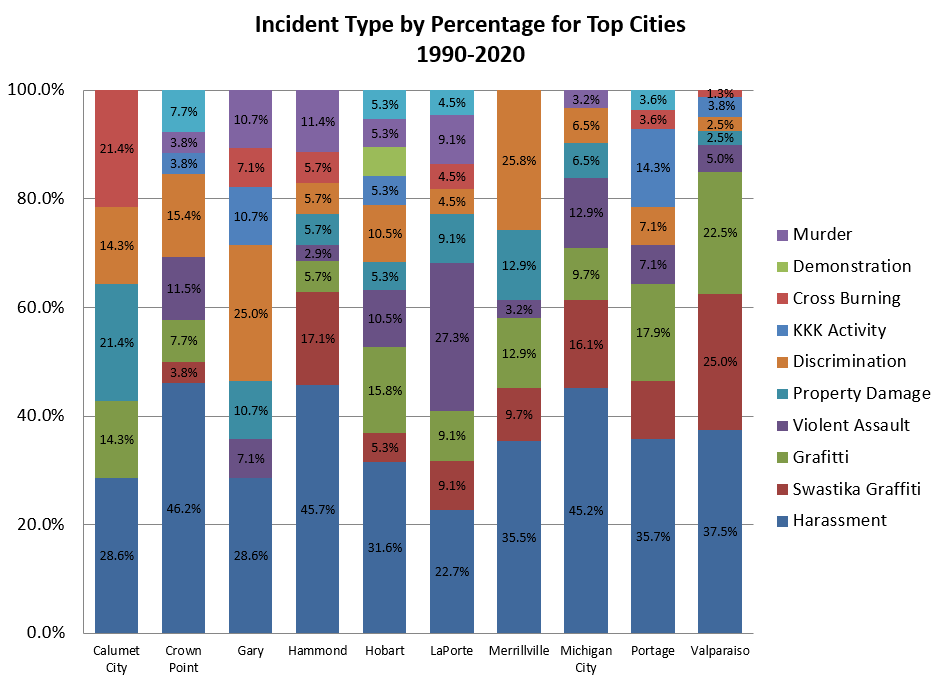
Top Ten Cities Incident Type, 1990-2024
This graph shows the percentage score of each type of bias motivated incident for the ten cities with the greatest number of incidents. It reveals trends in the data that may not be as easy to discern from other figures. For instance, in another figure one might correctly notice Valparaiso has the greatest number of incidents. However by looking at this figure it becomes apparent the majority of the incidents in Valparaiso are harassment. This figure also makes it apparent that while La Porte has fewer incidents than Valparaiso, the severity of those incidents tend to be higher, with more murders and violent assaults reported.