Bias Incidents: 1990-Present
Incidents by County
Incidents by Motivation
Incidents by Target
Incidents by Type
Average Severity of Incidents
Composite Severity of Incidents
Incidents by City/Town
Incidents by City/Town (%)
Incidents per Capita
Average Severity by City
Incident Type by City
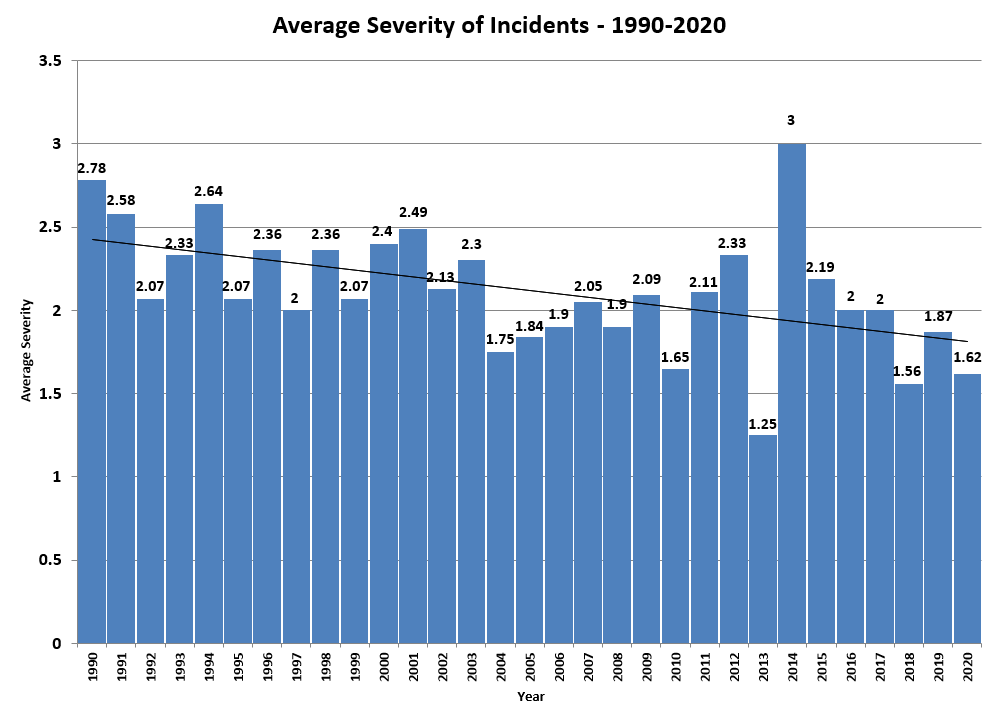
Average Severity of Bias Motivated Incidents, 1990-2024
A severity score between 1 and 5 is assigned to each incident, with 1 being the least severe and five being the most severe. The figure below presents the average severity of the events for each year for all of Northwest Indiana from January 1, 1990 through October 2024. The diagonal line moving from left to right on the graph represents the trend in the data. There has been an overall decrease in severity despite an outlier year in 2014. In 2014, an average severity of 3.00 was calculated, the highest since the study began. The years following 2016 show a decrease in severity, except for years 2021 (average severity of 2.19) and 2023 (average severity of 2.36).