Bias Incidents: 1990-Present
Incidents by County
Incidents by Motivation
Incidents by Target
Incidents by Type
Average Severity of Incidents
Composite Severity of Incidents
Incidents by City/Town
Incidents by City/Town (%)
Incidents per Capita
Average Severity by City
Incident Type by City
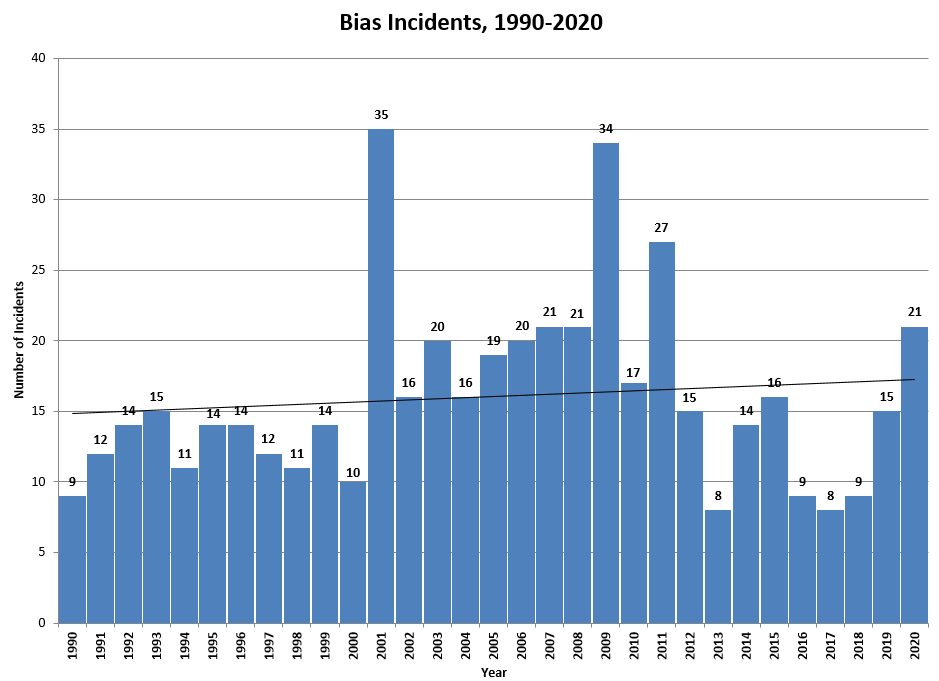
Number of Incidents by Year, 1990-2024
The following figure presents a graph of incidents by year. As indicated there is wide variation over time, but overall there has been a gradual average in the number of incidents. The number of incidents peaked in 2001 with 35 incidents, but since 2011 has varied.
